A candlestick chart is a tool used by investors to analyze the price movement and trading patterns of a stock or other security. It is a graphical representation that displays the price movement of an asset over a specified period of time, such as one day. Each trading period or unit of time is represented by one candlestick on the chart.
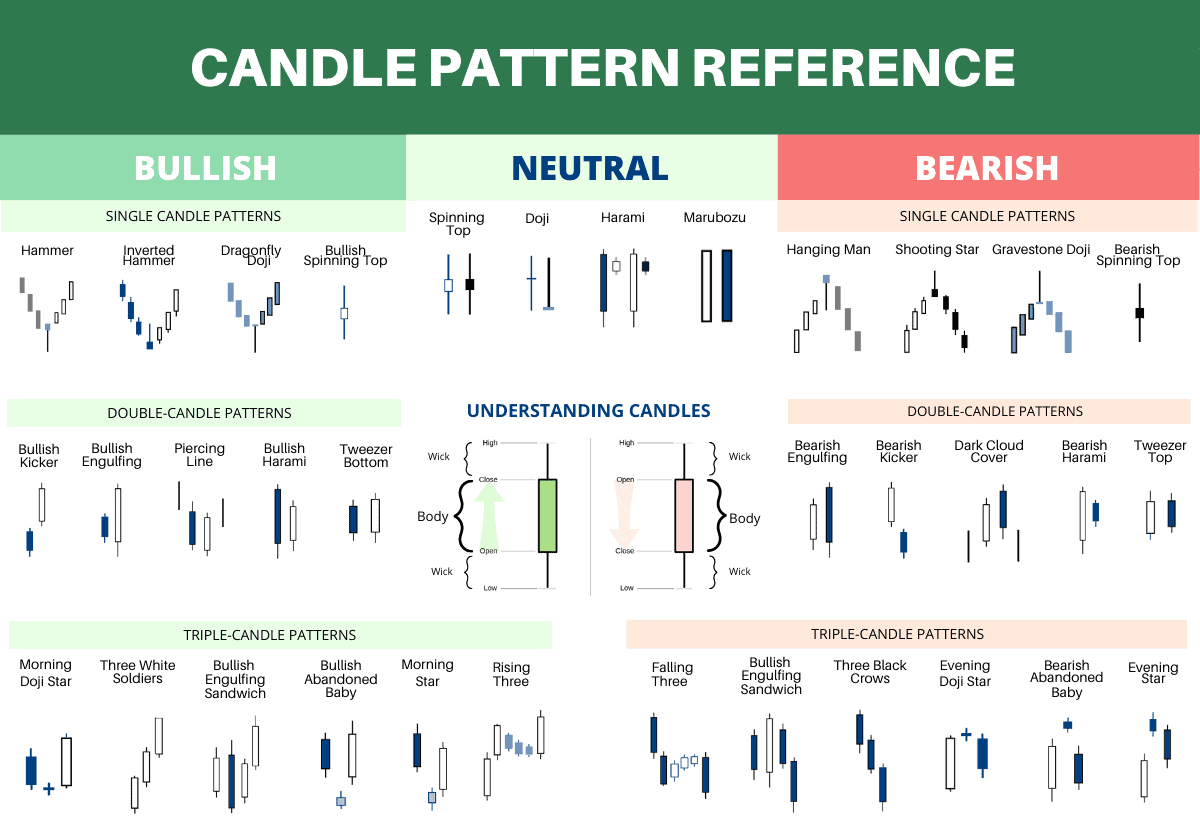
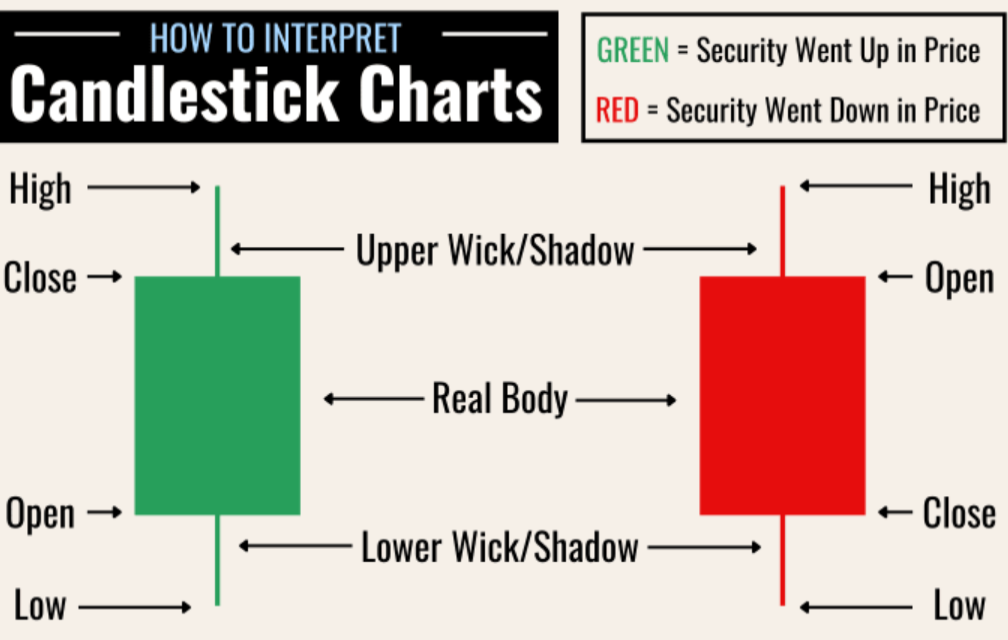
A candlestick can be visualized as a vertical candle that is burning at both ends. It has a real body, which is the bulk of the “candle,” and an upper and lower “wick” or shadow. Each candlestick provides five pieces of information about the security in question during the day (or time period) in question:
- Its opening price (represented by the top of the real body)
- Its closing price (represented by the bottom of the real body)
- The highest price it traded at (represented by the top of the upper wick/shadow)
- The lowest price it traded at (represented by the bottom of the lower wick/shadow)
- Whether the day’s closing price was higher (usually green or white) or lower (usually red or black) than its opening price.
Candlestick charts originated in Japan over 100 years before the West developed the bar and point-and-figure charts. In the 1700s, a Japanese man named Homma discovered that, while there was a link between price and the supply and demand of rice, the markets were strongly influenced by the emotions of traders. Candlestick charts show that emotion by visually representing the size of price moves with different colors. Traders use the candlesticks to make trading decisions based on regularly occurring patterns that help forecast the short-term direction of the price.