Support and resistance levels are horizontal price levels that connect price bar highs to other price bar highs or lows to lows, forming horizontal levels on a price chart. These levels are formed when a market’s price action reverses and changes direction, leaving behind a peak or trough (swing point) in the market. Support and resistance levels can carve out trading ranges like we see in the chart below and they also can be seen in trending markets as a market retraces and leaves behind swing points.
Price will often respect these support and resistance levels, in other words, they tend to contain price movement, until of course price breaks through them.
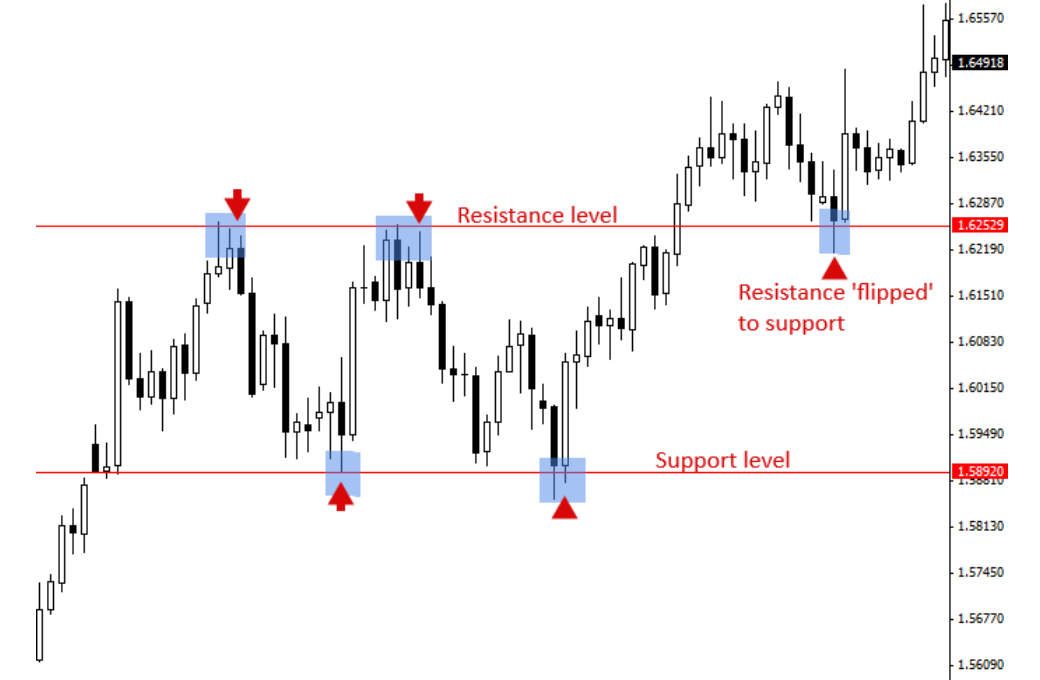
In the chart below, we see an example of support and resistance levels containing price within a trading range. A trading range is simply an area of price contained between parallel support and resistance levels like we see below (price oscillates between the support and resistance levels in a trading range).
Note that in the chart below, price eventually broke up and out of the trading range, moving above the resistance level, then when it came back down and tested the old resistance level, it then held price and acted as support.
Swing points in a trend are one of the primary ways support and resistance levels are created in a market. As a market trends, it retraces back on the trend and this retracement leaves a ‘swing point’ in the market. In an uptrend, the swing point looks like a peak, while in a downtrend, it looks like a channel.
In an uptrend, the old peaks tend to act as support after the price breaks up past them and then retraces back down to test them. Conversely, in a downtrend, the old troughs tend to act as resistance after the price breaks down through them and then retraces back up to test them.
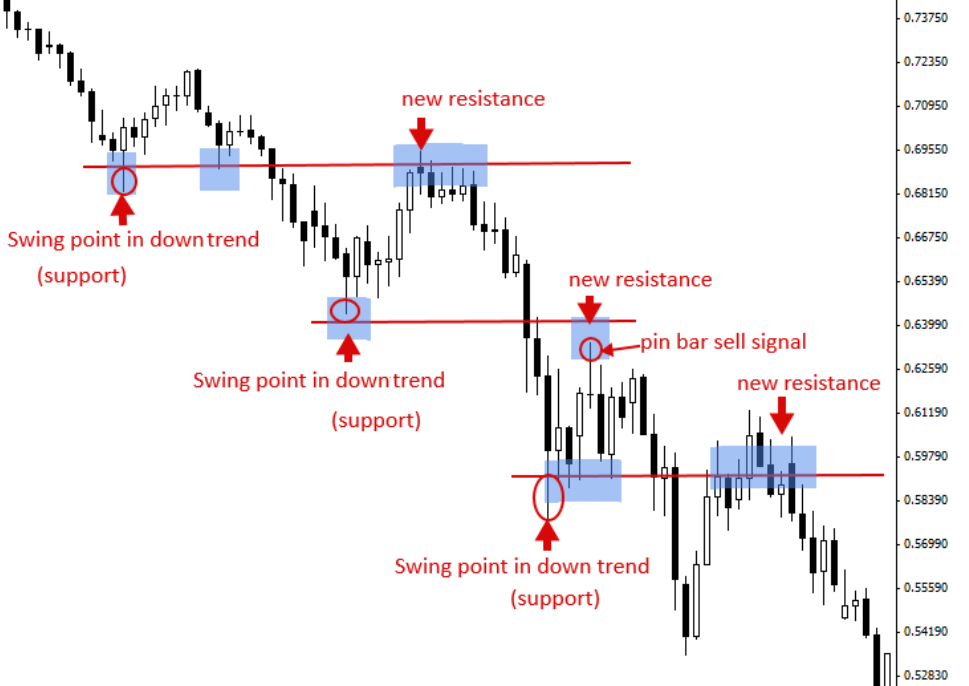
For instance, when a market tests previous swing points (support) in a downtrend, the level then behaves as ‘new’ resistance and will very often hold price. It’s wise to look for an entry point into a trend as it comes back and tests these previous swing points (see pin bar sell signal in chart below), because it’s at these levels that the trend is most likely to resume, creating a low-risk / high-reward potential.
When trading with price action, support and resistance levels are crucial. If a price action entry signal forms at a key level of support or resistance, it can be a high-probability entry scenario. The key level provides a ‘barrier’ to place your stop loss beyond, and since it has a strong chance of being a turning point in the market, there’s usually a good risk-reward ratio formed at key levels of support and resistance in a market.
The price action entry signal, such as a pin bar signal or other, provides us with some ‘confirmation’ that price may indeed move away from the key level of support or resistance.
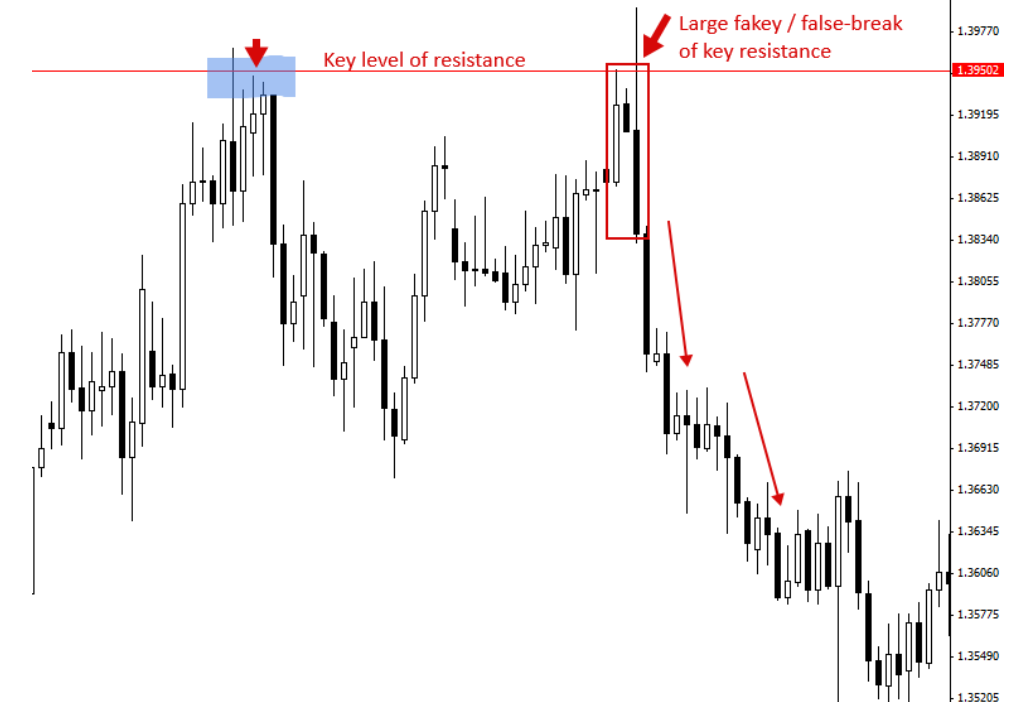
In the chart below, we see an example of a bearish fakey strategy that formed at a key level of resistance. Since this fakey showed such aggressive reversal and a false-break of the key resistance, there was a high-probability that price would continue lower following the signal.
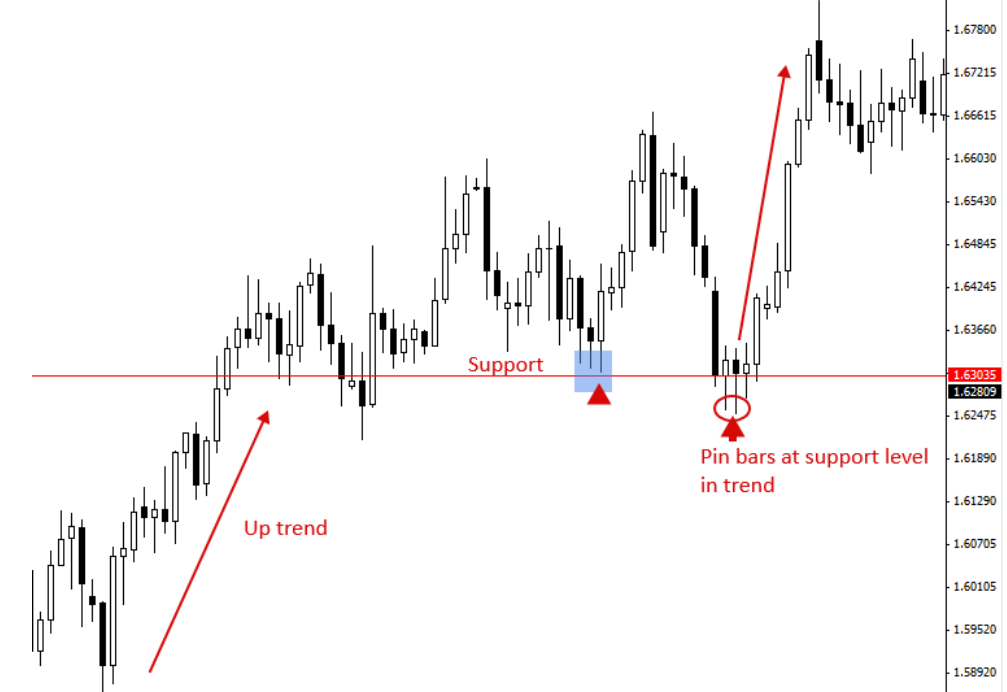
The following chart demonstrates how to trade price action from a support level in an uptrend. Once two clear pin bar buy signals were identified, the uptrend was ready to resume and pushed significantly higher from the key support level.
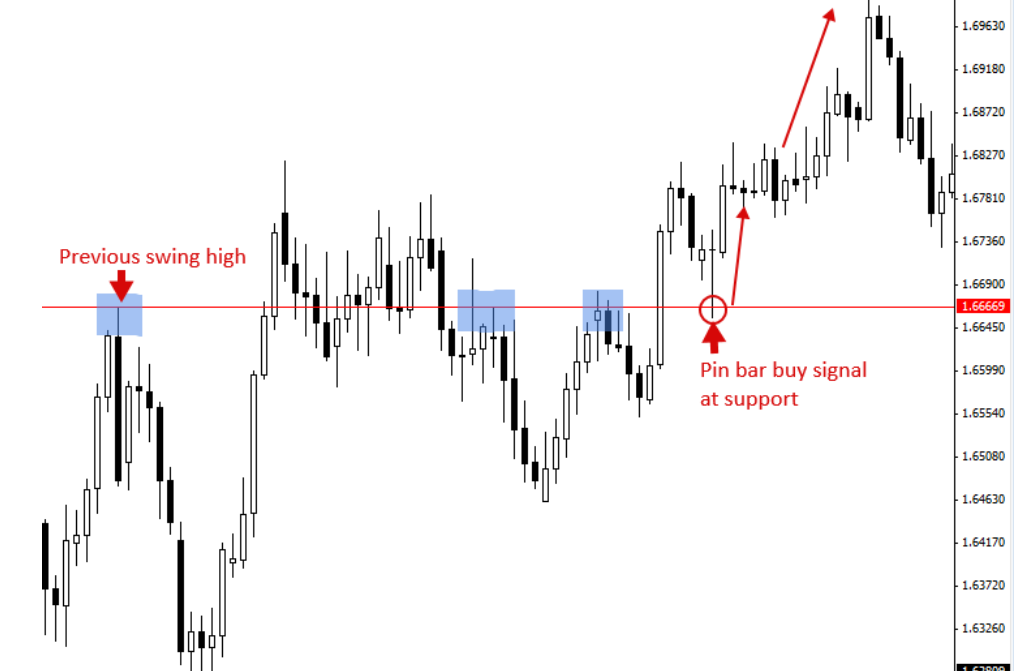
The chart example demonstrates how a previous swing level in trending markets can act as a new support or resistance level, providing a good level to focus on for price action entry signals. In this case, the trend was up, and a previous swing high in the uptrend eventually transformed into a support level after the price broke up above it. When the price returned to retest that level the second time, it formed a nice pin bar entry signal to buy the market and re-enter the uptrend from a confluent level in the market.
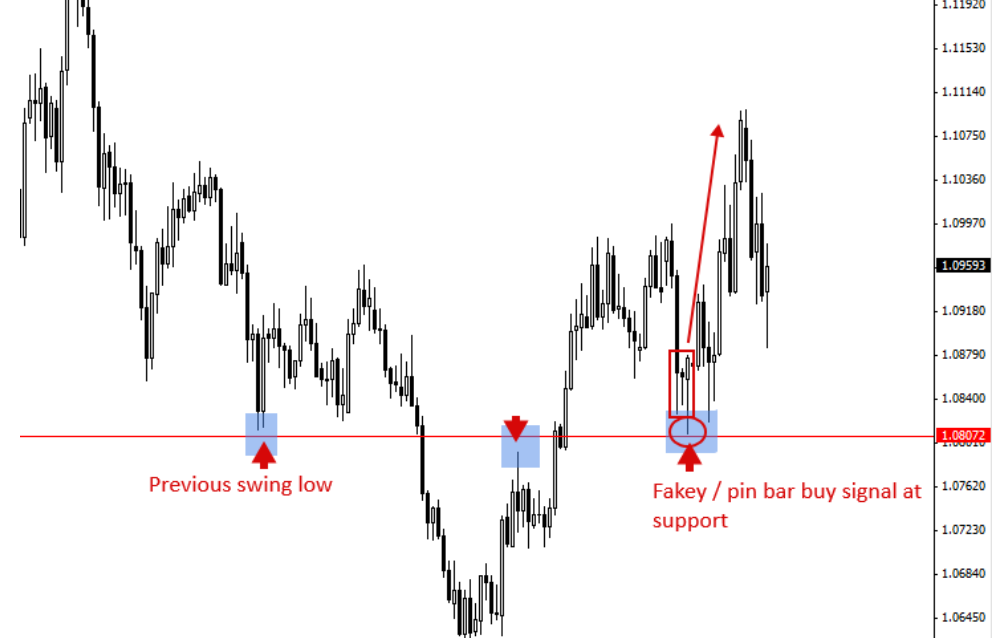
The final chart we are examining is intriguing. Observe the swing low that transpired during the downtrend on the left side of the chart. It’s remarkable how this level remained significant for months, even after the trend shifted from down to up. Initially, it served as a resistance level after the price broke down through it. However, once that resistance was overcome, an uptrend emerged. Subsequently, that same level acted as support, and that’s where we can see the fakey pin bar combo signal in the chart below.