In Forex trading, Chart Patterns play a vital role in Technical Analysis. They are graphical representations of price movements that can help traders identify potential trading opportunities. There are three primary types of chart patterns: Continuation, Reversal, and Neutral.
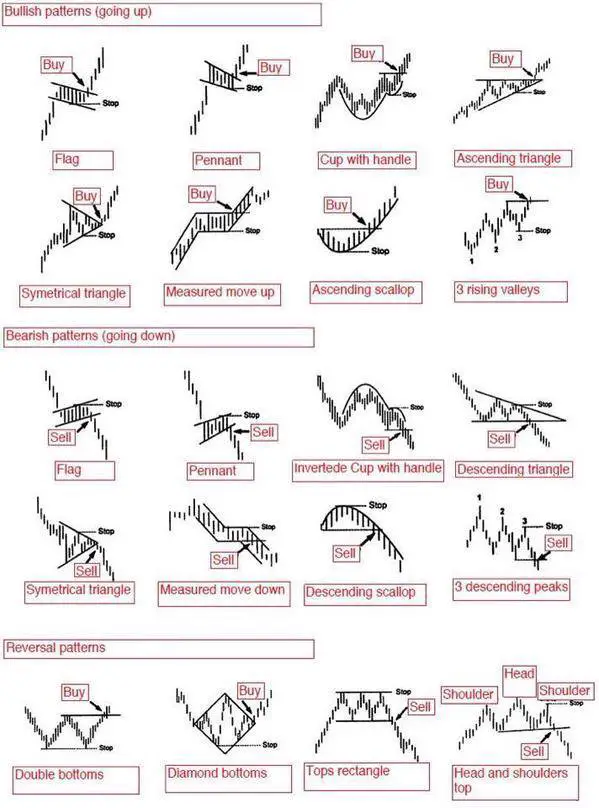
Continuation Patterns are price extension figures that signal the continuation of the current trend. Examples of continuation patterns include the flag pattern, the pennant, and the wedge. These patterns are useful for traders who want to capitalize on the current trend.
Reversal patterns, on the other hand, signal a change in the price direction. Examples of reversal patterns include the double top or bottom, the head and shoulders, and triangles. These patterns are useful for traders who want to identify potential trend reversals.
Neutral patterns are formations where the price direction is unknown. These patterns are useful for traders who want to stay on the sidelines and wait for a clear signal before entering the market.
Learning to recognize these patterns and their meaning is an essential part of Forex trading. It can help traders make informed decisions and improve their chances of success in the market.
Identifying Chart Patterns
• A pattern is defined by at least two trend lines, either straight or curved.
• All patterns have entry and exit points that are combined.
• Patterns can be either continuation patterns or reversal patterns.
• Patterns are fractal, meaning that they can be observed in any charting period, such as weekly, daily, or minute.
• A pattern is not considered complete or activated until an actual breakout occurs.
Types Of Chart Patterns
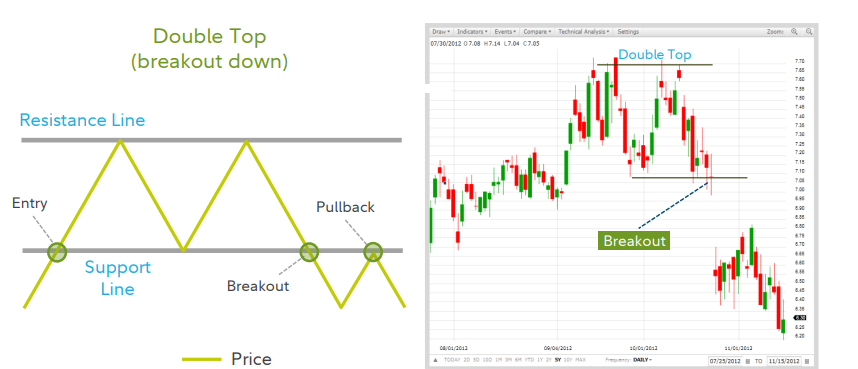
The Double Top Pattern is characterized by two consecutive peaks separated by an opposite reversal point. These peaks can either be rounded or pointed and are usually at roughly the same price (resistance level). For the pattern to be confirmed, the price must break out of the middle reversal point.
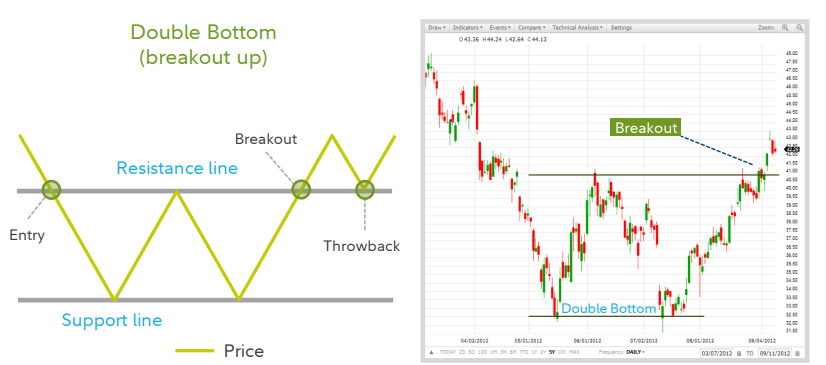
The Double Bottom Pattern is characterized by two successive troughs separated by a peak. The troughs can either be rounded or pointed and are usually at roughly the same price (support level). For the pattern to be valid, the price must break out of the middle peak.
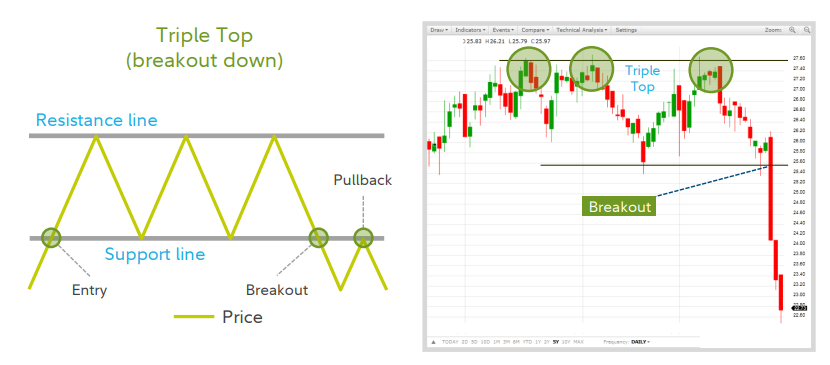
The Triple Top Pattern is characterized by three distinct peaks that occur at approximately the same price level, separated by two intermittent channels. The pattern indicates a potential reversal in the movement of an asset’s price. A breakout occurs when the price exceeds the extreme of the intermittent channel or a trend line connecting those points.

The Rectangle Pattern is a trading range that is bounded by support and resistance levels, with price action oscillating within these bounds. It has a slight tilt, similar to a horizontal channel, and is often characterized by many false breakouts.
When dealing with the Rectangle Pattern, it is important to confirm a breakout before taking any action. A “shortfall” is often an indicator of the eventual breakout direction, and the best occurrence may be a bottom breaking upward.
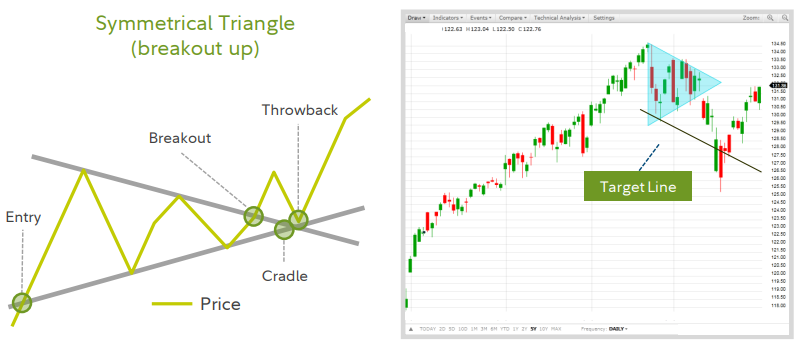
The Symmetrical Triangle Pattern is a chart pattern that is characterized by two converging trend lines connecting a series of sequential peaks and troughs. The upper trend line is downward sloping, while the lower trend line is upward sloping. Both bounds are straight trend lines. For the pattern to be valid, prices must touch each bound at least twice. However, there are many false breakouts, and the pattern is only moderately successful in performance. The best occurrence may be upward breaking out, which is above average for all patterns

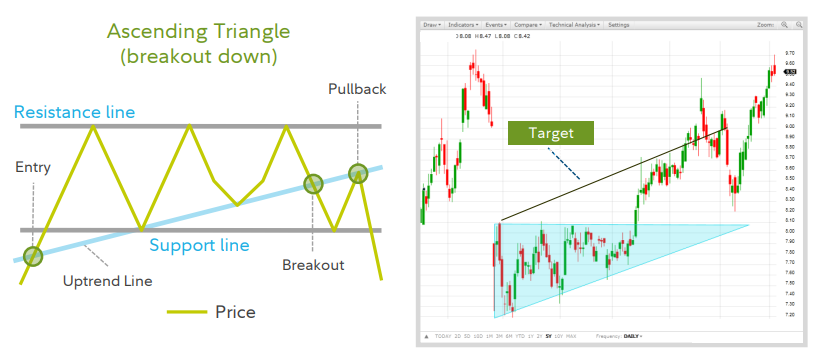
An Ascending Triangle Pattern is a technical analysis chart pattern that is bounded by a horizontal upper trend line and an upward sloping lower trend line. Each bound is a straight trend line. Prices can break in either direction, but more commonly upward. The breakout usually occurs within the pattern. Although the failure rates are average, there are many small false breakouts. The post-breakout performance is average on the upside but above average on the downside.
The Descending Triangle Pattern is a technical analysis chart pattern that is characterized by two trend lines. The lower trend line is horizontal, while the upper trend line slopes downward. Prices can break in either direction, but they most commonly break downward. If there is an upside break, the performance is above average, but retracements occur often.
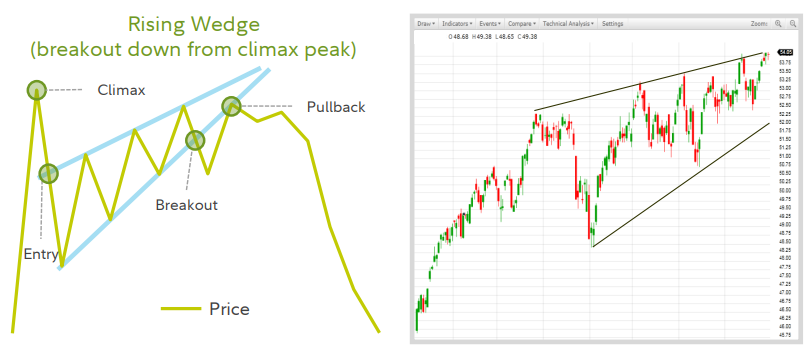
The Rising Wedge Pattern is characterized by two trend lines that are headed in the same direction and bound the price action. Before a breakout, the price must touch a trend line at least five times, with three touches on one trend line and two touches on the other. This pattern often occurs following a panic (declining wedge) or bubble (rising wedge). However, the performance of both types is below average, and retracements are very common.
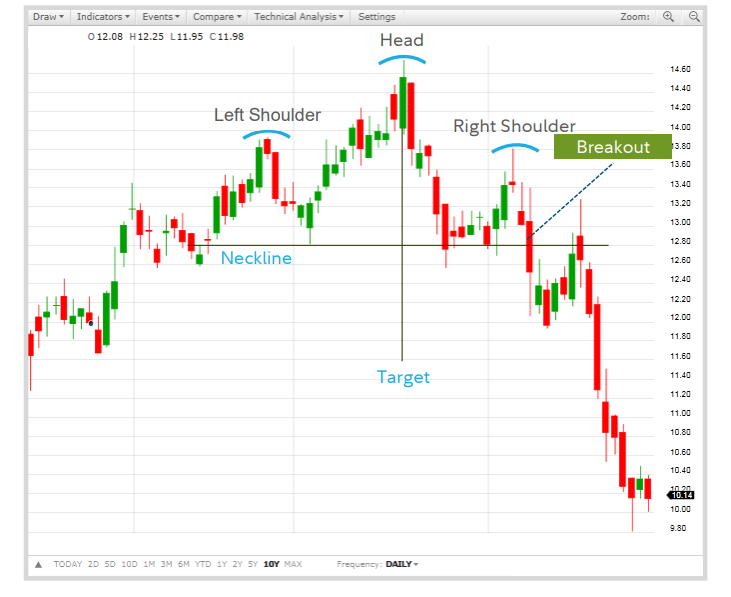
The Head and Shoulders Pattern is a technical analysis chart formation that predicts a bullish-to-bearish trend reversal. The pattern consists of three peaks, where the outside two are close in height, and the middle is highest. The head and shoulders pattern forms when a stock’s price rises to a peak and then declines back to the base of the prior up-move. Then, the price rises above the previous peak to form the “head” and then declines back to the original base. Finally, the stock price peaks again at about the level of the first peak of the formation before falling back down. The shoulders should be at approximately the same level and the head higher. The line connecting the two troughs between the peaks is called the “neckline”. The pattern is only complete on breaking the neckline. The target is the distance from the head to the neckline projected from the neckline. This is a standard pattern for tops and has one of the lowest failure rates.
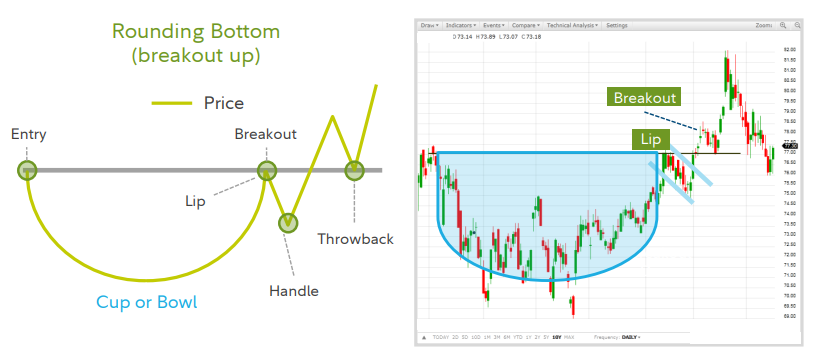
The Cup and Handle (Rounding Bottom) pattern is a bullish candlestick pattern that is used to spot opportunities to go long. The pattern consists of a cup-shaped price consolidation, which includes a downward price movement, a stabilization period, then a price increase of about the same amount as the downward movement. This is followed by a sideways pullback between the high and low of the cup shape, forming the handle. The pattern is complete with a breakout above both lips. It often has a throwback. The pattern’s performance ranks about average for bottom patterns.
More Patterns